|
Finding the slope of a best fit line |
Adding Slope eqn and R^2 (fcn of 'straightness' of line) to graph
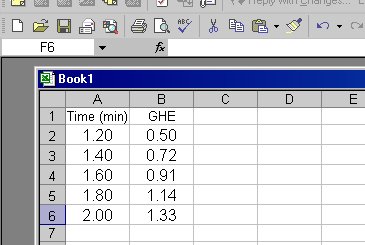
1. Insert your data in two adjacent columns of Excel. The values in column A wil be your X-axis values, the values in column B, your Y values.
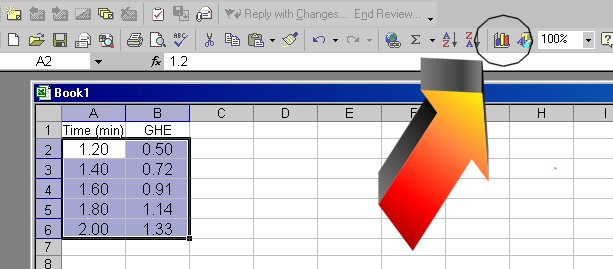
2. Highlight the cells, and click on the chart wizard button
3. Follow the 4 steps of the chart wizard. Most graphs done in
this chemistry class will be 'XY-scatter' graphs. Also make sure you include an
appropriate title and label the axes (step 3 of 4)
4. When done, you will get the graph displayed. Right click on one of the
data points (they will then all be highlighted) and choose 'add trendline'.
4. Click on 'linear' in the trend/regression box
5. Click on 'options' at top of box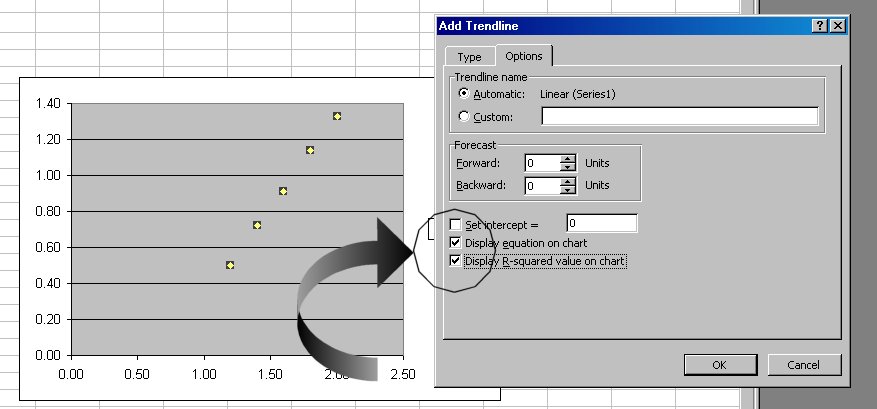
6. Click on small box in front of the 'Display equation on chart' and 'Display the R-squared value on chart'
7. Click 'OK'
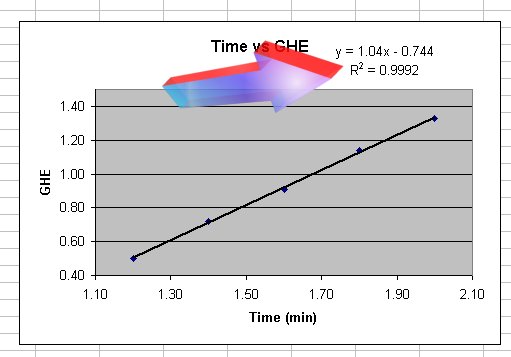
8. You will now have the equation displayed and an R2
value. The R2 value gives you an indication of how well your equation
fits your data. an R2 value of 1 means it is an exact fit.
9. You can click into the equation and change the 'y' to be more information, as well as the x:
10. To add more digits in the presented number in the equation, right click on the equation and chose 'format data labels'. Click on 'number' tab. In the list on the left, click 'number' and then to the right put how many decimal places you want to be shown in the numbers of the equation. If using the euqation for any calculations (usually) you will want to change it such that at least 4 significat figures are given (NOT 4 decimals places)
10. Make the graph look nice, neat, and professional.
11. Highlight the entire graph (not the chart) and place it in a MS Word document (your lab report?) and shrink it down such that the graph is less than 1/3 of a piece of paper in size.
Send Doc Ott questions or comments here
Last Updated
07 Sep 2006