Objective:
To introduce some fundamentals techniques for measuring mass and volume and to learn apply the rules of significant figures.
Discussion:
In science it is extremely important to be able to make measurements correctly. Reliable measurements allow for factual knowledge about measurement. As you continue your studies in chemistry and science you will learn by performing experiments that important properties of matter such as density depend on specific measurements.
Numbers and measurement
There are two general categories of numbers: Exact numbers are of absolute accuracy, having infinite precision,whereas measured numbers are of finite accuracy with limited precision
Exact numbers are absolute values because there is no uncertainty in the value. For example counted numbers are exact numbers the number of people in your lab section or the number of fingers on your hand defined numbers such as 12 inches per foot. 16 ounces per pound are also exact numbers. To say there are 28.5 people in your lab section is meaningless. Anything other than 16 ounces is not a pound. These are exact numbers. The accuracy and precision of any calculation does not depend on exact numbers. Measured numbers are the numbers can be the length of a material measured by a linear dale or the mass of a substance measured by a balance. Several measurements should be made to verify measured numbers. The accuracy of a measured numbers is calculated from the average of the measurements, how close the average is to the “true value” In the absence of a determinate error or systematic error the accuracy of a group of measurements should be very high the precision of a measurement depends upon the uncertainty of the individual measurements. The precision of a measured numbers maybe be large if the measured values vary, but the accuracy could be very high if the average comes close to the true value. On the other hand the precision of a measured number may be small if all the measurements have similar values but the accuracy could be very low if the average of those similar numbers is far from the true value
Every measurement has two parts: the numerical value and the unit. Both must appear when quoting or recording a measurement. The numerical value provides the accuracy of the measurement while the unit tells us the dimension or property which has been measured. Without both parts the unit and the value the measurement can be confusing or meaningless.
Measurement and the 10% rule.
The number of significant figures in a measurement always includes one estimated digit when reading the measure value on a calibrated scale. We include one estimated digit because it is standard practice in making a measurement to complete the measurement by reading or estimating 0.1 times (or 10%) of the calibrated separation. Between the nearest adjacent calibrations of the measuring device. The estimated digit represents the uncertainty of the measurement. When reading the measurement on a digital output, the instrument will usually list the uncertainty of +/-1 for the last digit.
Volume measurements
The volume of a sample is the total amount of space occupied by the sample. When cooking, liquid volumes are measures in units of teaspoons, and tablespoons and cups. In the lab liquid volume are typically measured by using graduated cylinders or volumetric glass wear. Such glass wear is read by observing the bottom of the meniscus level of liquid and reading to 0.1 times (the 10% rule) of the smallest calibrated mark.
Mass measurement and weight
Mass is measured in the laboratory by using a balance. Electronic balances can be tared when performing mass measurements to tare a balance means to set the display equal to zero while the container is on the balance then the mass of the matter being weighted can be directly reads from the balance without having to subtract the mass of the container.
Average Results and Standard Deviation
Consider a set of valid experimental results. Set means a group of results which are related in that each result refers to the same quantity. Valid means that each result is acceptable and has been obtained by performing measurements correctly within the limits of the experimental accuracy. Rather than report the entire set of values, we prefer to report the average result for each set. The average result is the sum of all individual results in the set divided by the number of results.
Before lab, you must be familiar with how to calculate averages and standard deviations (SD). Standard deviation is defined as
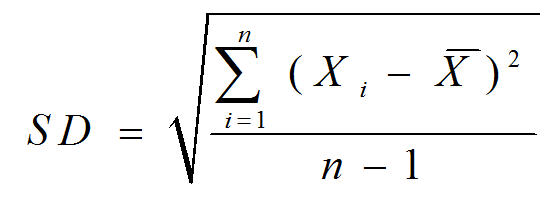
Where Xi = the value of each data point
 = the average of all the data points
∑ = the Greek letter sigma, meaning “sum of”
n = the total number of data points
If you do not know how to 'use' this equation, you might want to do some research. Internet?
The Penny
From 1959 through to 1981, the U.S. Mint produced more than 130 billion pennies all of pure copper with a density of 8.96 g/mL. Then, in 1982 the Mint introduced a penny that is 97.6 percent zinc and only 2.4 percent copper with a density of 7.07 g/mL. The copper-plated zinc penny is identical in size and appearance to its copper-rich counterpart, but the current cent is 19% lighter.
The Experiment
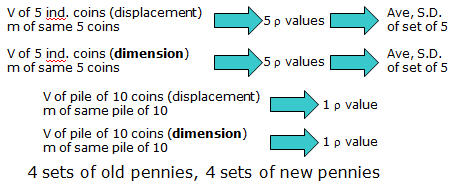
In this experiment, you will determine the density of individual coins as well as a group of coins. The masses will be measured with analytical balances. The volume of individual coins and the group must be done by two different methods. This will give a total of 8 different groups of densities for you and your lab partner.
(5x individual old pennies) x 2 Volume methods
one group of 10 old pennies x 2 Volume methods
(5x individual new pennies) x 2 Volume methods
one group of 10 new pennies x 2 Volume methods
You will then calculate the average density of a single penny from the 8 methods. You will also calculate and report the standard deviation of the two sets of individual 5 coin measurements.
A picture: